Problems in business today are often very complicated. Failures in service or disruptions in process almost always have more than one cause. When analyzing these various problem aspects, Quality Assurance professor and noted author Kaoru Ishikawa said to “think of at least four factors which influence your problem. See if a shift in one of these causes can give you a different effect to explore.” Ishikawa developed a diagram to help problem-solving teams visualize the various causes and effects of a problem. This model is called the Ishikawa Diagram or as it is more commonly known, the Fishbone Diagram.
What is the Fishbone Diagram?
The Fishbone Diagram is a map that problem-solving teams can use to sort out various aspects of a problem into different categories. It features the problem statement (effect) in the center of the map with different causes branching off of it. The map resembles a fish skeleton – giving it its name, the Fishbone Diagram.

By using the diagram, teams can come up with deeper, more robust solutions for their problems. They can focus on individual aspects of the overall, complex problem and help reveal causal relationships between the individual issues that created the problem. The diagram can also help uncover system bottlenecks and reveal why processes are not working correctly.
Have processes that aren’t working correctly in your supply chain? Let us help you fix them: LEARN MORE
When Should Problem-Solving Teams Use the Fishbone Diagram?
Teams will typically use this visualization tool for more complex problems or if teams are in a rut with their thinking processes. Writing out the problem makes it less abstract and formatting it in the diagram helps pinpoint exactly where problem causes exist. Each industry may design their own diagrams differently; but many companies will focus on problems within the 6Ms categories (Machines, Methods, Materials, Measurements, Mother Nature, & Manpower) when deciding how to design and use their own diagrams. There are no strict rules of when this technique should be used, but it is best utilized for problems with more than one cause or that are complex in nature.
How to set up the Diagram
First, the problem-solving team needs to decide how to record the diagram. This can be accomplished with a paper flipchart, whiteboard and marker, or computer program with the diagram pattern. Whatever the team has on hand should work as long as they can see the diagram and update it effectively.
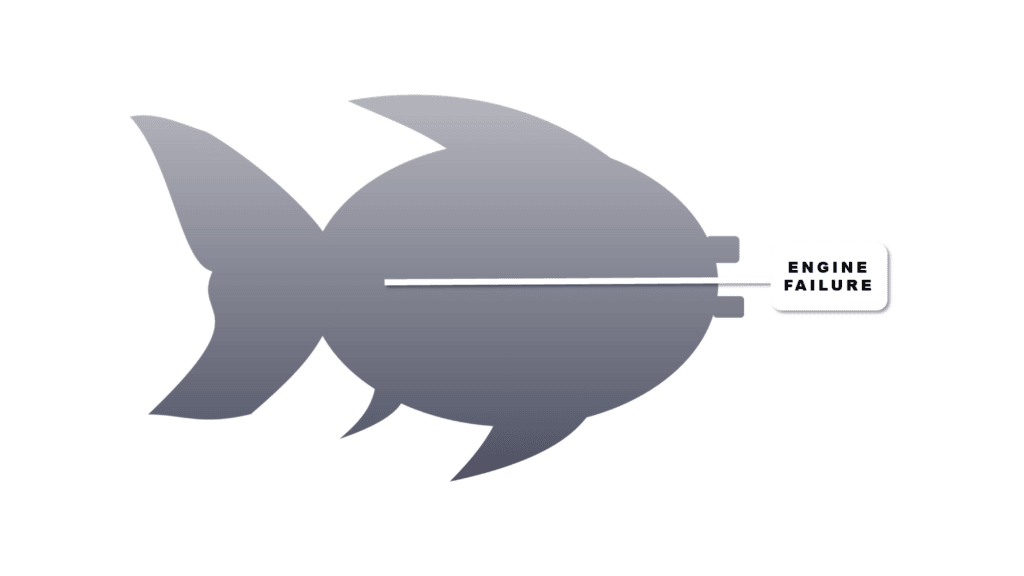
Next, they need to agree on the problem statement or effect. This is what is being solved. Once decided, they will take the problem statement and draw it in the center of the map and mark a square around it. Then, draw a horizontal arrow coming off of the square.
Ex: Customer has an engine failure in their truck. Problem: Why did the engine fail?
Once the first branch is drawn, make more branches coming off of the horizontal line for the major categories of problem causes.
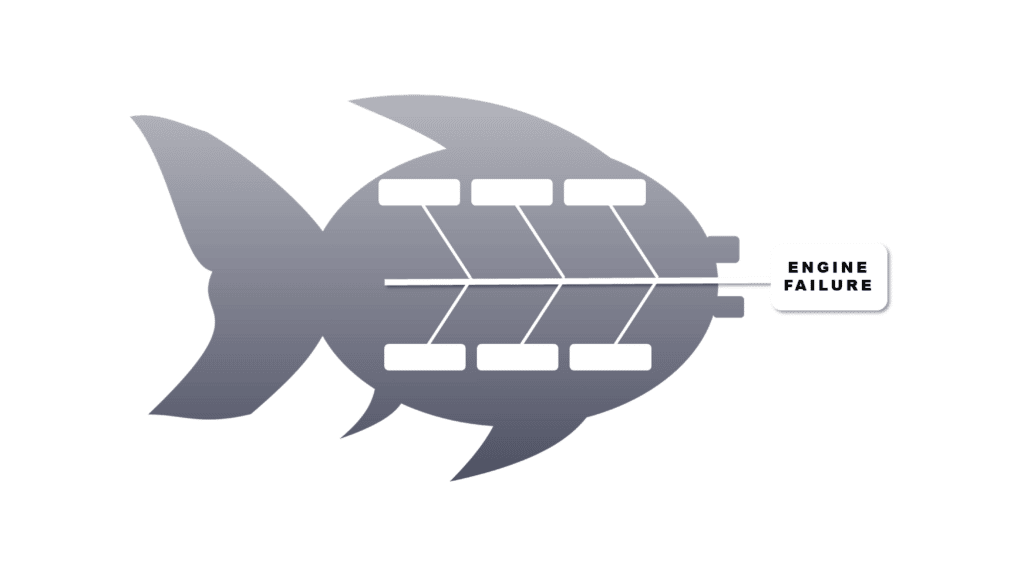
These can be specific to each individual company or industry, but it is safe to use the 6Ms as they are all encompassing categories of what most companies use to complete tasks and how those companies complete those tasks.
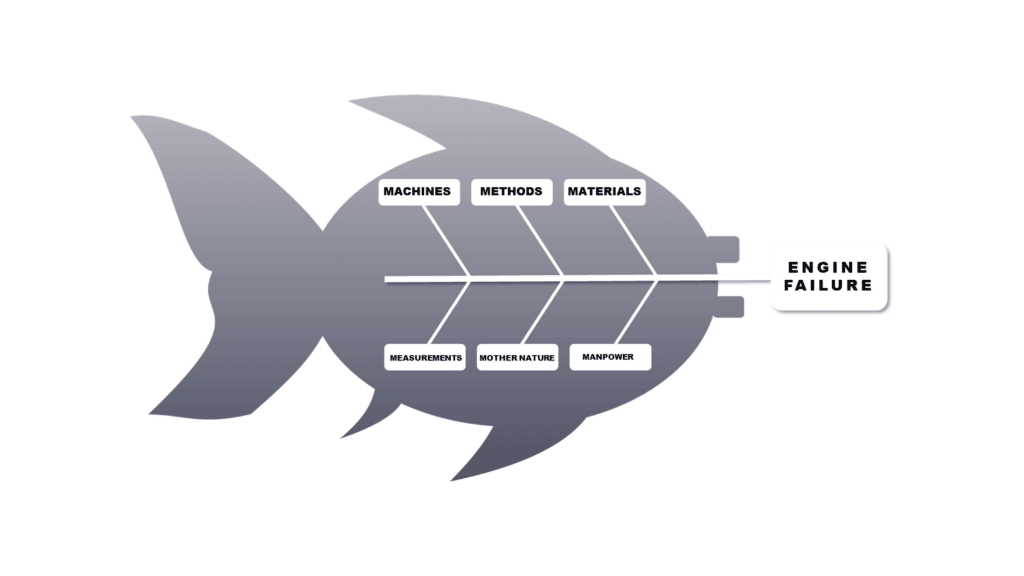
1. Machines include the tools or machines needed to complete tasks.
2. Methods are the production and support processes the company uses.
3. Materials make up the raw materials, parts, components, and supplies used for production.
4. Measurements are the physical measurements, auto-sensor readings, or inspections companies make with their products or machines.
5. Mother Nature involve both natural events like weather or environmental factors like lighting or air conditioning.
6. Manpower are people and people issues- whether it is a lack of training, lack of personnel, or personal problems the workers face.
The team will then start brainstorming possible problem causes and mark the reason for the problem as a branch of one of the main problem categories. Ex: Problem: Why did the engine fail? One cause – a fluid hose broke. A faulty hose could be listed under the Materials category. If it was installed wrong, it could be listed under Methods or Manpower, or both.

The next step is to take these causes and ask why they happened. Ex: Why was the hose faulty? The manufacturer built the hose incorrectly. If it was installed wrong – Why was the hose installed wrong? The employee installing the hose needs more training – etc.

The reason for the causes can be broken down using the 5-Why Method to determine the root cause for each individual problem. Then each individual problem will form layers that can be totaled to solve the whole complex problem. Categories that do not have many ideas can be focused on in greater detail.
Using the Ishikawa or Fishbone Diagram is an effective way problem-solvers can visualize a complex problem. Writing the problem out makes it less abstract and easier to determine the causes. When problem-solvers place the problem at the center of the diagram and branch causes off of it, they can see exactly what is causing a problem, draw causal relationships between various issues in related categories, and come up with solutions. Problems in business today are often very complicated, but when they are visualized and broken down into smaller individual causes and effects, there is no problem that cannot be solved.
At ProTrans, quality and continuous improvement is in our DNA. Let’s continuously improve your supply chain: LEARN MORE